Sharpe Ratio: Connecting Risks & Rewards
 By: Robert F. Abbott, freelance writer and author
As you do your fund-buying research, you will no doubt look at the potential rewards or yields, which show how much the fund has grown in the past. But, have you considered the risk, where the fund fits on the spectrum of low-risk to high-risk mutual funds? And have you used the Sharpe Ratio?
The latter will give you one number for every fund you’re considering, a number that defines the relationship between the fund’s risk and reward. The Sharpe Ratio makes your research easier and more insightful.
In this article I will explain the Sharpe Ratio; how we get to that one number and examples of what it means. In turn, that will make you a smarter buyer and investor.
This is one in a series of articles in which we examine the key metrics of top mutual funds at the U.S. News & World Report website. They include: Top Mutual Funds: As Defined by You; Mutual Fund Basics: Name & Description; Charts & Mutual Fund Analysis; Mutual Fund Performance; and Mutual Fund Fees: An Introduction.
Before proceeding further, please note the mutual funds in this and other articles are only examples, not recommendations. Similarly, although I like the way U.S. News & World Report website provides mutual fund information, I might have chosen to work with others.
What is Mutual Fund Risk?
When people in the mutual funds industry speak of risk, they often use the word Volatility. Normally expressed as a Standard Deviation number, it describes how much the price of a mutual fund varies over a specific period. Here are charts of two mutual funds, showing their price movements over three years:
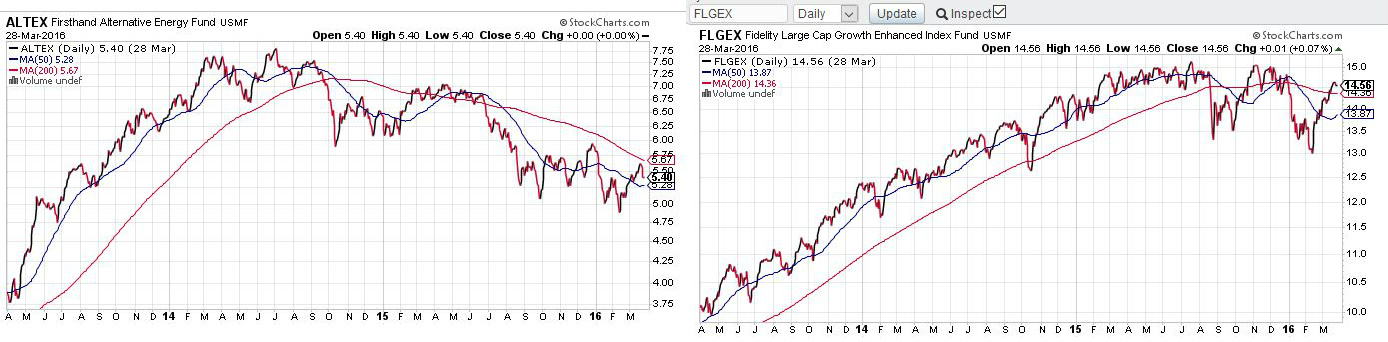
Obviously, the prices of ALTEX (on the left) have gone up and down more than FLGEX (on the right). One has more price variation, and so we call it more volatile. Fund analysts would say the fund with more volatility (more standard deviation) is riskier than the fund with less volatility (less standard deviation). Now, let’s put some numbers to the volatility of each, with these screenshots from the fund profiles at U.S. News & World Report website (ALTEX on the left and FLGEX on the right):
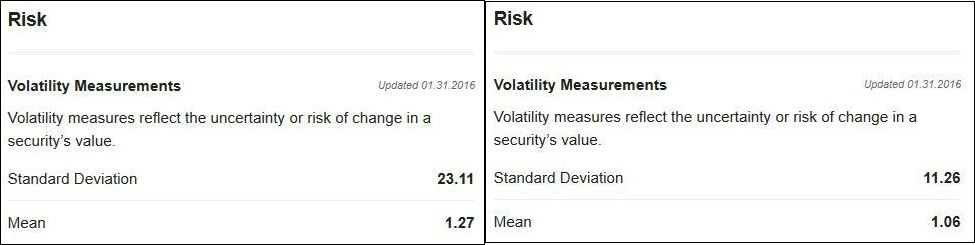
Without getting into details, we can see the standard deviation for ALTEX is 23.11, while the standard deviation for FLGEX comes in at 11.26. In other words, ALTEX is nearly twice as volatile as FLGEX. That won’t come as a surprise when we learn ALTEX is a basket of energy or energy-related stocks (oil and gas prices have dropped dramatically since the summer of 2014, as you can see on the chart above).
For those with a bent to or interest in statistics, you can find lots of information online about standard deviation and the mean. For the rest of us, it’s enough to say that ALTEX has more volatility than FLGEX.
Higher volatility means the price of a fund can drop further and faster than the price of a less volatile fund. It also means prices can go up further and faster as well. Higher volatility can become a problem if, or when, you want to sell some or all of your fund units. Imagine how trapped you would feel holding on through several years of a recession, or even a depression.
Volatility, Returns, & the Sharpe Ratio
What if you could combine all this information about the volatility as well as the returns of mutual funds in one number, a number you could use to compare funds with one another?
That’s what we find in the Sharpe Ratio, a number that summarizes the relationship between risk and returns, thus simplifying your research. Briefly explained, the Sharpe Ratio will tell you how much return you receive for each unit of risk you expose yourself to. And, as a result, we generally consider higher numbers better investment prospects.
Without getting far into the arithmetic, the Sharpe Ratio is calculated by subtracting a risk-free rate, such as a government bond (call it 0%, 1%, or 2% for convenience) from the mutual fund’s published rate of return. Then, divide that number by the volatility, or standard deviation. Providers of this information normally base the Ratio on data for the previous three years and update it monthly.
Given two funds with the same amount of volatility, the one with the higher rate of return will earn a higher Sharpe Ratio number. Alternatively, given two funds with the same rate of return, the one with less volatility will generate a higher Sharpe Ratio number. Of course, you can also have some combination of the two.
Now, let’s compare a few funds, using data from the U.S. News & World Report website:
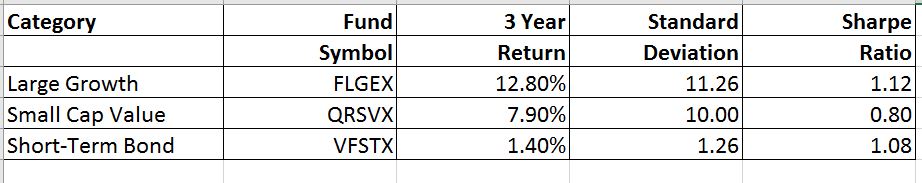
With this information, we’re set to compare apples to apples, rather than dealing with the proverbial apples and oranges.
Looking at the table, we see FLGEX and VFSTX provide the highest Sharpe Ratio numbers, and statistically, there’s not much difference between them. What’s notable, though, is the differences in return; while the two funds have nearly the same risk/reward ratio (Sharpe Ratio), FLGEX has a return that’s nearly 10 times greater; obviously a better prospect than VFSTX.
Turning to FLGEX and QRSVX, note that the former has both a better Sharpe Ratio, and a better rate of return. All else being equal we would expect FLGEX to be a better prospect.
However, the Sharpe Ratio should be just one element of your buying or selling decisions. You will also want to think in terms of a diversified portfolio, and that means holding different categories, including large cap and small cap, in whatever proportions.
You will want to check each fund’s holdings and ask about the future of the biggest of them. For FLGEX, the five biggest are the huge tech companies: Apple, Amazon, Microsoft, Verizon, and Alphabet (formerly Google). Do you expect these companies to continue the torrid growth they’ve clocked in the recent past?
What do the charts show? Does it show a price line steadily rising, or do you see a choppy line? Is the fund currently trading above its 200-day Simple Moving Average?
These are just a few of the questions to ask before making a decision. And, as we’ve seen, we can clarify some of the important issues by constructing a spreadsheet like the one above, and entering the information for funds on your short-list. You can add to the spreadsheet by adding additional columns to make notes or list data.
Conclusion
Exploring the Sharpe Ratio has opened our eyes to a new way of comparing top mutual funds. Rather than closing our eyes and stabbing at a list of funds with our finger, we can logically and methodically compare them.
We discussed briefly the elements that drive the Sharpe Ratio: volatility (in standard deviations) and the returns (3-year). Ideally, you want to aim for higher returns and lower volatility, and the Ratio gives us good concrete information about the relationship between risk and reward for every fund.
It’s all part of the process of making better buying and selling decisions by doing good research on the mutual funds that interest us.