Mutual Fund Performance
 By: Robert F. Abbott, freelance writer and author
Mutual fund performance tends to be a key measure we turn to when shopping for funds. That, in turn, leads us to lists of best mutual funds or top mutual funds.
As a starting point, let’s note that a mutual fund’s performance is based on the percentage it has yielded over several past time periods. The most common of those periods are:
- 1 month
- 3 months
- Year to date (January 1st to current date)
- 3 years
- 5 years
- 10 years
- All time
Few providers of fund data provide all these data points, so take care you compare apples with apples when using different providers.
For each of those periods you will see percentages, which show how much the value of the fund has risen or fallen during that period. Most firms that provide rankings of funds, such as Top Mutual Funds or Best Mutual Fund lists, incorporate one or more of those mutual fund performance numbers in the mix of information that comprises standings on their lists.
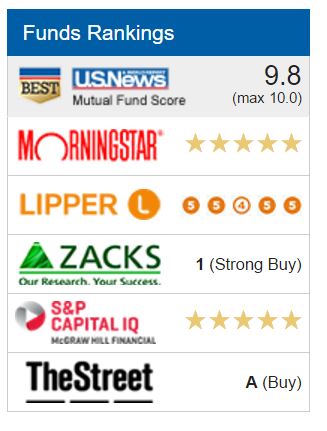
In this article, we look at the numbers for the Fidelity® Large Cap Growth Enhanced Index Fund, which occupies the #4 position on the list of Best Large Growth funds in the U.S. News & World Report rankings (as of March 21, 2016). The U.S. News rankings, in turn, are based on the ratings of experts in five other organizations (Morningstar, Lipper, Zacks, S&P Capital IQ, and TheStreet):
What We Need to Know about Mutual Fund Performance Numbers
Before looking specifically at this mutual fund’s performance numbers, let’s first review two important points from an article at Investopedia:
“A mutual fund’s performance is always expressed in terms of its total return, which is the sum of the change in a fund’s net asset value (NAV), its dividends and its capital gains distributions over a given period of time.”
and
“Total return figures are calculated and expressed net of a fund’s expenses, i.e., those included in a fund’s expense ratio. Investors in load-funds should note that in fund literature and the financial press, generally, the performance of these funds is reported without adjusting for the impact of the sales charges.”
The first point explains the components of the performance:
- Changes in the net asset value – how much the quoted daily price has gone up or down over the time period.
- Dividends – any dividends paid by the corporations and passed on by the mutual fund company, whether directly to us or reinvested.
- Capital gains – distributions, often in December, of any net gains the fund has generated by selling stocks for more than their purchase price.
The second point provides a reference to expenses; the performance figure is net, which means after deducting expenses.
Now we’ve clarified what those percentage performance numbers tell us, let’s review a specific fund, the Fidelity® Large Cap Growth Enhanced Index Fund, as shown in this U.S. News & World Report web page.
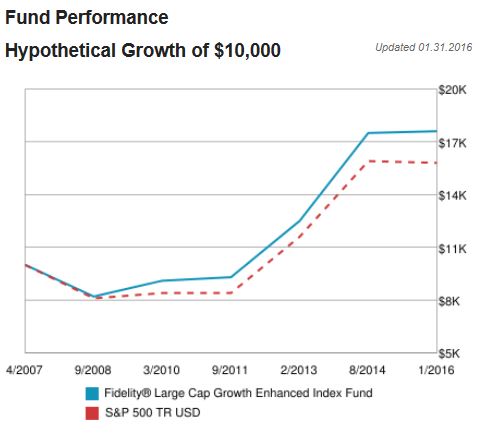
First, and most obviously on this page, we have a price chart with two lines. The upper, solid blue line tracks the value of a theoretical lump-sum invested in this fund on the day it was created. It ends on January 31, 2016, which will have been the most recent filing date.
The line below it, the dotted red line, tracks the value of an equal sum invested in the S&P 500 Index, also on the day the fund started.
The latter, the S&P 500 line, provides a benchmark against which we assess most stock mutual funds. It prompts the question: “Would I have been further ahead to have just bought an index fund and avoided all the research and fees involved in buying and owning an actively managed fund?”
If the blue line persistently stays below the red line, then Yes, you should have bought an index fund. For those of us doing research, we will want to see the blue line stay above the red line for most if not all of the fund’s history, or at least most of the history shown. FLGEX has done that, by outperforming since the beginning of the financial crisis in September 2008.
By staying above the red line, FLGEX has shown it is a good fund, one that deserves its fourth place position on the U.S. News & World Report’s list of best large cap growth funds.
Incidentally, mutual fund companies often compensate fund managers based on how well they did when compared to the S&P 500’s returns. Funds with good performance ratings and history attract more buyers, and profits, than poorly performing funds.
Now, we move to the percentage returns, the performance, of the Fidelity Large Cap Growth Enhanced Index Fund (for an introduction to figuring out what fund names, see my article Mutual Fund Basics).
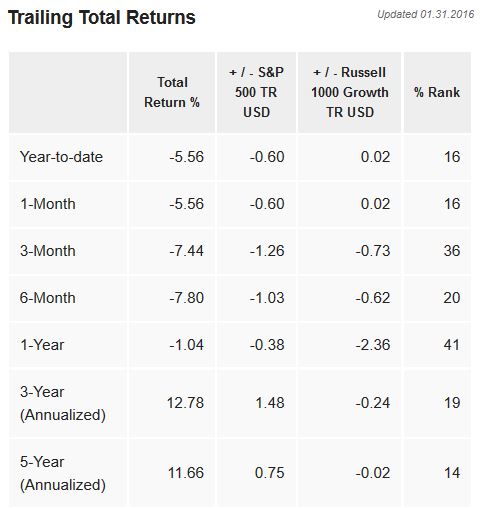
Trailing total returns refers to the fact the percentages are based on the past, not the future. Total returns refers to the sum of increases in the fund’s unit price, dividends, and capital gains. As noted it is also net of expenses, in other words, after deducting expenses.
The date, 01.31.2016 refers to the most recent date on which the fund managers filed official forms. The table shows comparisons with both the S&P 500 Index and the Russell 1000 Growth Index, the latter comprising riskier stocks than the former.
Reflecting the turmoil in stock markets in late 2015 and early 2016, the 1-Year return trails the S&P 500, but outperformed in the S&P 500 over three years and five years. It has mostly underperformed the Russell index.
The most valuable line of the chart is the 5-year, which tells us how the fund has fared over several ups and downs in the stock markets. As the % Rank column indicates, few funds have done as well; again, that explains why the experts rated it highly enough to get a spot on this best funds list.
All of this refers to past performance, and does not guarantee similar performance in the future. Still, as Richard Loth noted in this Investopedia article, “. . . past performance is what we have to work with – and it’s much better than a crystal ball.”
We also understand a high ranking does not mean a buy recommendation, nor that a low recommendation means a sell recommendation. Rather, we understand that ranking mutual fund performance provides a tool with which we can analyze, and make better decisions.